Farm Business Management
Practical pasture decisions for farms that need clear, reliable information.
Everything you need to know about Farm Business Management
Farm Business Management is a broad area that includes the pillars or land, livestock, environment, finance. Our goal is to get the perfect balance for sustainable outcomes.


As a livestock farm owner or manager, you already manage several aspects together. For example, you manage livestock by taking care of their nutritional, health, physical and emotional needs.
But you also manage production on your farm by ensuring that production levels don't fall. At the same time, you also manage several general aspects of your farm that may include managing effluents, irrigation, or fertilization. And finally, you also manage the farm's finances, labour, infrastructure and ecology.
Good farm business management includes all these aspects and more. For our purposes, we may broadly categorize farm business management into the following five broad areas:
- Livestock management
- Production management
- General farm management
- Financial management
- Environment, labour and infrastructure
I bet that you’re already able to see how each of these five areas depend on each other and affect the overall farm. Since we’ve already covered about animal health, pasture management and land management in other articles – we won’t talk about them here. Instead, let’s talk about managing production, taking effective decisions and getting finances as well as budgets to work for you.
In this guide, you’ll learn about:
- Defining successful farm outcomes based on your unique strengths/ needs
- Managing your production based on where you are currently at, on the profit curve
- How information systems can help you take effective farm decisions on a daily basis
- Understanding diminishing returns and how to use this as an effective decision making tool
- The 3 financial documents of your farm business and how to use them effectively
- Key areas to consider while planning and budgeting for the year ahead
Read this guide now to get an in-depth overview of the six critical business management areas that you need to learn about to propel your livestock farm business to its next level.
1. Successful Farm Management Outcomes
Let’s begin with the obvious. What do you want from your farm?
Most farmers would say that they want more profits. This is probably a key outcome for you too. And because you can only achieve more profits through effective production and cost management – it often becomes a yardstick to measure management efficiency.
But if I ask you to dig a little deeper, you may respond with other outcomes such as improving animal health or increasing production. Some farmers might even talk about reducing overall costs. And lastly, a few farmers might also talk about reducing losses due to weather, diseases and pests.
So, successful farm management outcomes may follow the lines of:
- Improve profits by x%
- Improve production by y%
- Improve animal health in the areas of a, b and c
- Reduce costs by z%
- Reduce losses due to weather, diseases and pests
But this is not a comprehensive list of successful outcomes by any means. You may identify a few more outcomes that are specific to your needs.
For example, if you’re a farmer prone to fire outbreaks, you would want to include fire prevention strategies as one of your key outcomes.
Or if you run a family farm, you might want to include improved quality of life as a key outcome.
The point is that you can only benefit from identifying your top 3 to 5 successful farm outcomes, based on your unique needs.
2. Managing Production
When it comes to production management, you know that more production per animal or per hectare often means more profits.
But there may also be situations where increasing production may not be your best bet. There may be situations that even demand a reduction in your production.
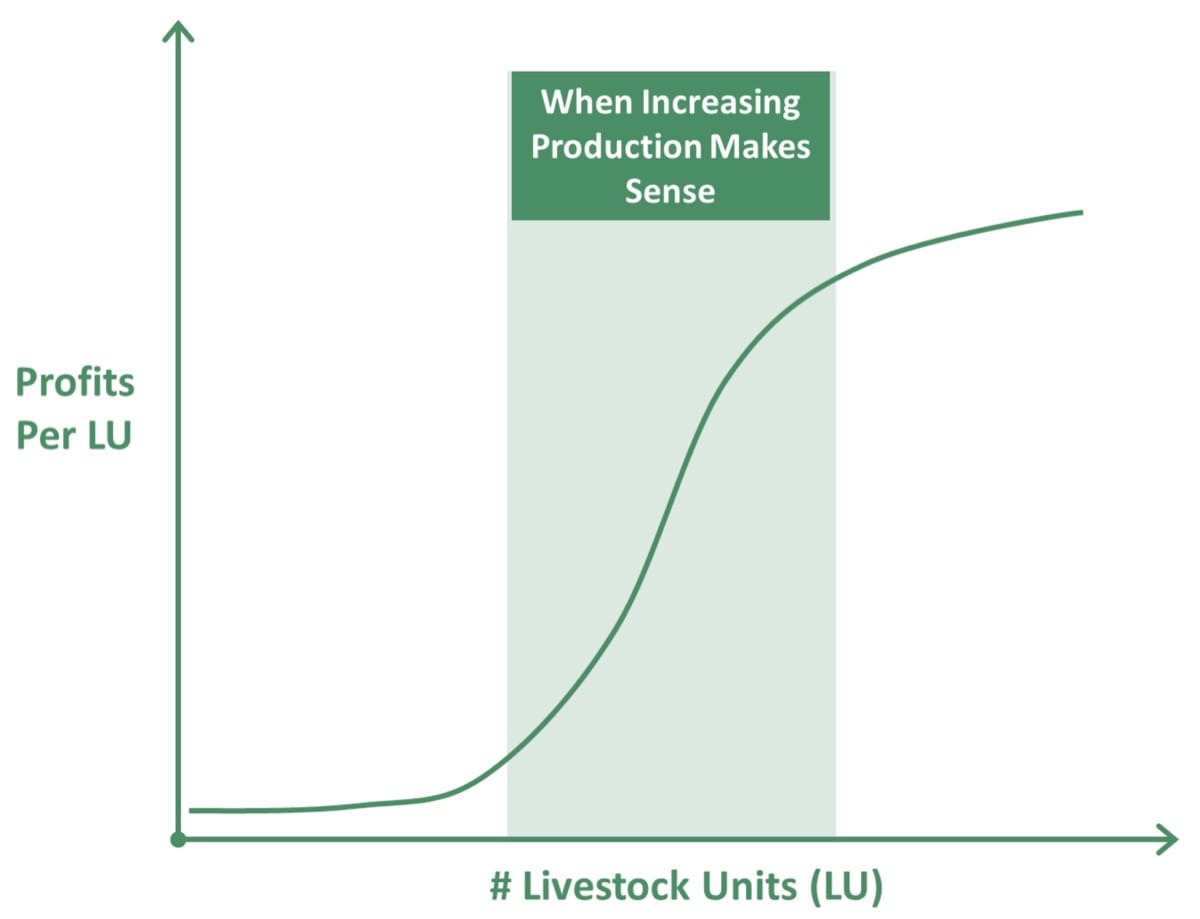
Allow me to introduce you to the profit curve (profit dollars per livestock unit) and use it to look at three production management scenarios in detail.
#1 Increasing Production
There are several ways of increasing production. The most obvious way is to expand production.
For example, a dairy farm with 250 cows on 200 hectares of land may look to expand the herd by up to 400 dairy cows. Because there are relatively lesser unknowns and variables, this is often the preferred choice of increasing production.
Another way to increase production is to diversify.
For example, the same dairy farmer, instead of expanding the number of dairy cows, may choose to buy several beef cattle or sheep. And in turn, diversify his source of income across various products.
Diversifying production offers more significant opportunities to earn more profits by developing multiple production systems that feed off each other.
However, this also offers the most significant risks and may require the most additional investment.
Lastly, one could also increase production by increasing efficiencies.
For example, the same dairy farmer can find ways to increase milk production outputs per cow. To do this, he might actively pursue opportunities to improve his pasture yields and quality, which in turn would increase milk outputs by 15% to 30%.
This, however, may need more meticulous record-keeping that could help the farmer make more effective grazing decisions on a daily basis.
In all these scenarios, your goals would be to unlock more resources that fuel increased production. Typically, this may involve taking loans or investments.
In other cases, it might involve partnering with other people or business entities on a profit-sharing basis.
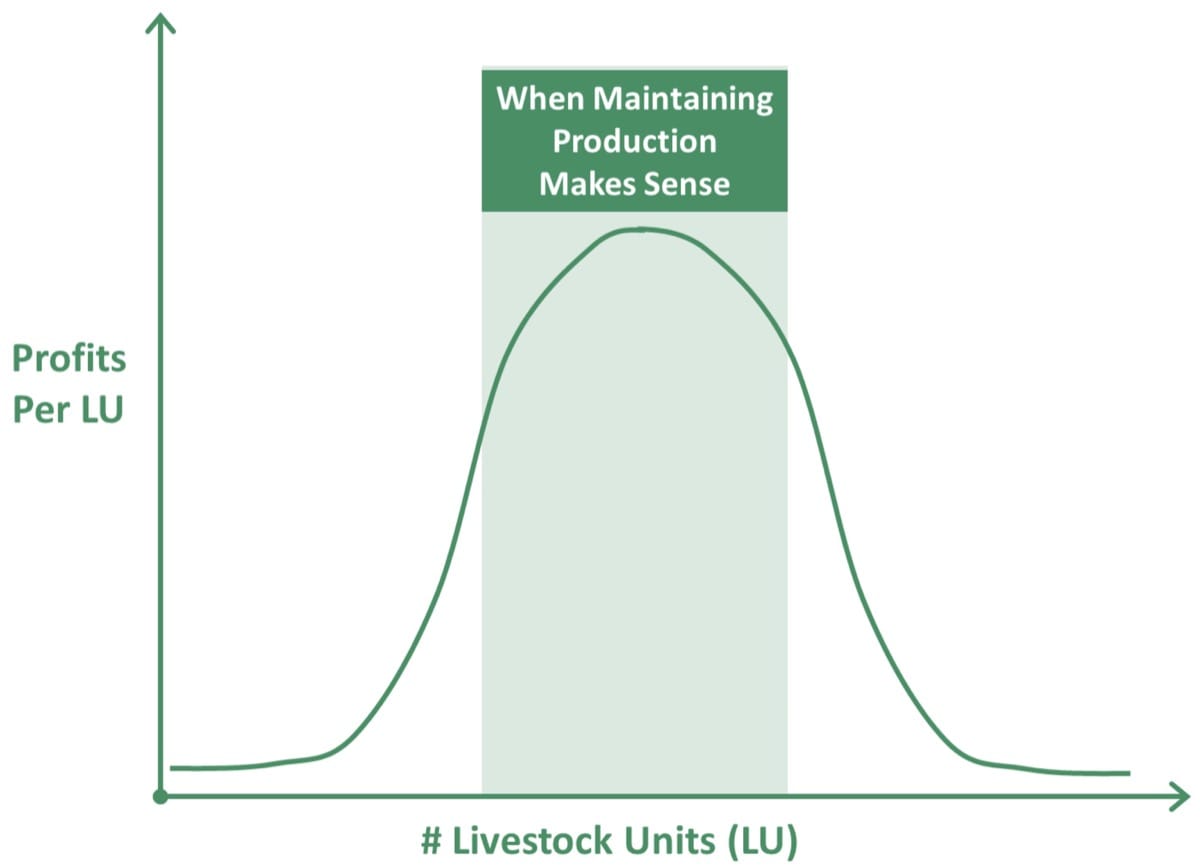
#2 Maintaining Production
But everything is tied back to naturally occurring self-limits.
So instead of a never-ending exponential growth curve, as shown above, the profit curve over significant livestock increases becomes a bell-shaped curve after a point. In other words, when the number of your livestock unit begins to exceed the carrying capacity of your land, accessible capital or operations – the profits per animal starts declining.
In other cases, farm owners might want to maintain current levels of production, as a conscious decision of improving their quality of life.
These are usually good signs that you're happy with how your farm is performing. Usually, at this point, farm priorities might change towards minimizing effort and costs.
In such situations, maintaining production around current levels might be your best course of action.
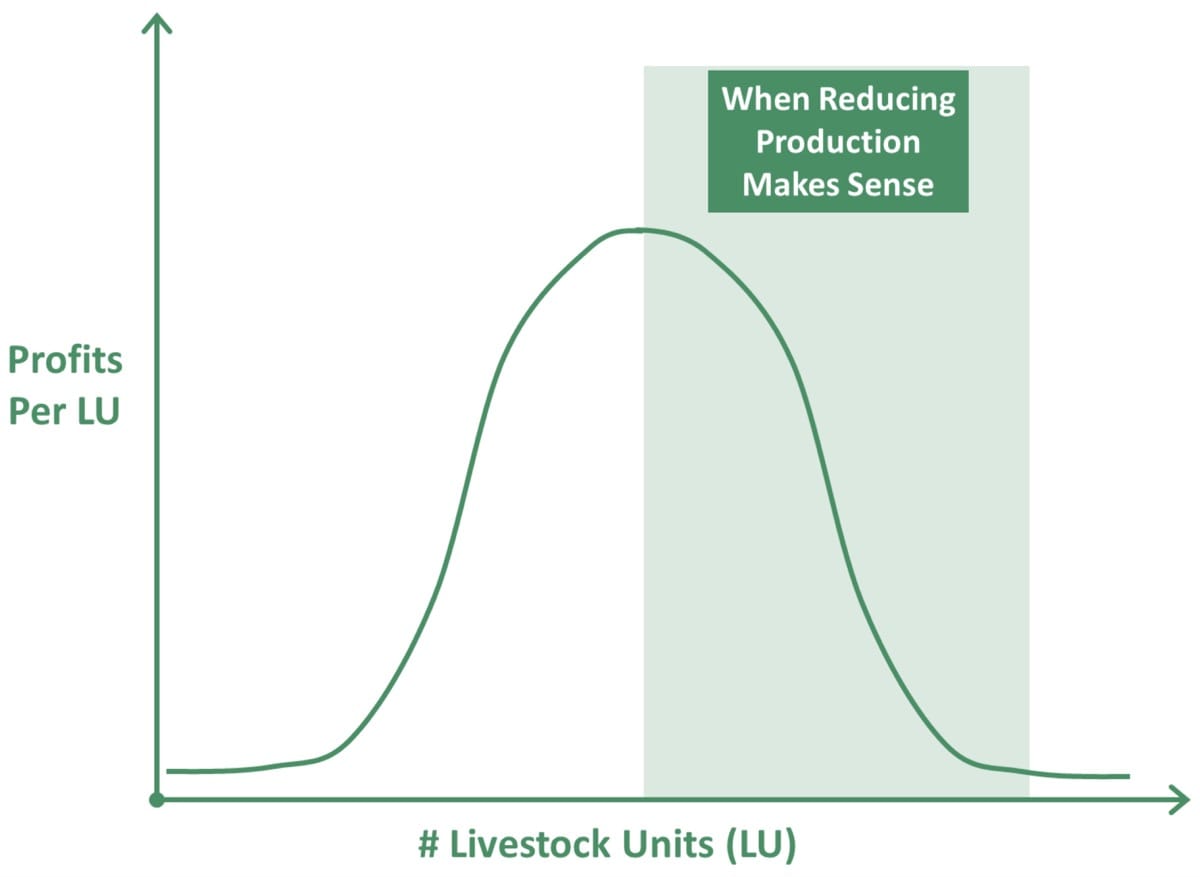
#3 Reducing Production
And at times, you might even want to reduce your production.
This may happen as a result of external circumstances, such as an extended period of drought. Or it may happen if you realize that you've stretched yourself too thin in terms of time, money and other resources.
The goal then would shift towards achieving more profits with lesser overheads.
What does all this mean to you?
Your biggest takeaway from this – is to honestly assess your farm and identify where it falls in this profit curve today.
This can give you a context to guide all your production management decisions.
In addition to this, it also shows you two things.
Firstly, it shows you the importance of constantly monitoring and collecting reliable data about different aspects of your farm.
For example, you might collect data about your animal feed intakes, pasture growth and fertilizing needs. Over a period of time, this data will help you see patterns and help you take more effective evidence-based decisions.
Secondly, it shows you the need to be on top of your numbers. So at any point in time, you know the best possible course of action.
For example, because you know your pasture growth rates and how it responds to irrigation and fertilization, you can weight these costs against buying hay. Over a period of time, the cumulative gains of these small decisions add up to give you successful farm outcomes.
I’m sure you’re asking yourself two important questions now:
- How to collect and maintain important farm data over a period of time?
- How to determine which course of action is better?
The next two sections on information systems and differences will help you answer these questions.
3. Record Keeping, Information Systems and Effective Decisions
Factual data has an ability to cut through beliefs, opinions and biases.
For example, irrespective of what you believe, your pasture growth data and how it compares to other farmers in your region can highlight how much money you’re leaving behind, every year. Your pasture production data can tell you if buying hay is a better option than pasture grazing your animals.
Similarly, data on animal feed intakes and production can show you how your pasture can improve farm profits.
It’s not an accident that the top 10% of farmers who enjoy better productivity and profits, seem to know a lot about their farm and its limits.
I would argue that because they’ve seen their farm perform across several seasons, years and decades, they know what works and what doesn’t work for them. And data can help you see these patterns and trends over time.
Some farmers prefer to collect data in detailed charts and logbooks. Others prefer digital software to do the same.
The question isn't about, which is better—both work. You have dozens of chart examples, free spreadsheet templates and even free software that allows you to do this.
The more important questions are:
- Do you collect enough quality data about your farm today?
- Do you know how your animal feed intakes vary across seasons and feeds?
- Do you know how much you’re losing out on by not maximizing your pasture?
If not, I think this could be your biggest limitation.
I’ll end by saying that there are a series of states between these two decision making processes.
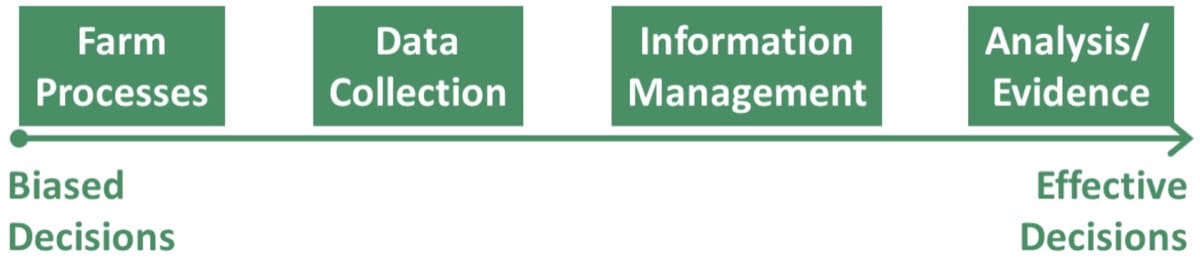
Your farm processes help you collect data and store them as records over a period of time.
And a sound information system can help you analyze evidence and help you make unbiased, effective decisions. It's essential to recognize where you fall within this spectrum. That’s half the battle won.
If you’re interested in using a digital information system for your farm – consider signing up for our forever free plan.
4. Understanding Differences & Diminishing Returns
In addition to data, the other part about taking effective decisions is comparing your options against reliable reference points.
For example, you may have accurate pasture growth data, and that might help you predict how much it will cost you to grow what quantity of herbage this year.
But how would you know whether this is your best course of action or not, unless you compare it with an alternative?
The alternative, in this case, might be buying hay instead of growing your pasture.
To do this, you need to understand the difference between both options.
For example, on a good rainfall year, you might compare the cost of growing pasture; say at about 50 dollars per ton with buying hay at about 100 dollars per ton.
Or consider you're in a drought and have to spend 6,000 dollars to buy a megalitre of water to irrigate your pasture. Then buying hay, even at 150 dollars per ton is a better option.
This is how data, information systems and analysis can help you make effective decisions. But there’s also a cost to this. So it is also important to realize how much is good enough and when optimization begins to become counter-productive.
In other words, it’s important to recognize diminishing returns.
One way to understand diminishing returns is to think about a farmer achieving record yields with a particular crop.
With some effective decision making, any farmer can achieve about 60% to 80% of his yields, with little additional effort.
However, the last 20% increase in yields can cost significantly more time, money and inputs. If not for name and fame, the record yield producing farmer wouldn’t himself bother going the last extra mile.
Put differently, beyond a point; the extra effort isn't worth the extra yields.
That’s the territory of diminishing returns. A territory that is best avoided.
5. Your Farm Finances
To understand your farm finances, you need to understand three financial documents, namely – income statement, cash flow statement and balance sheet. Collectively they are known as financial statements.
Any registered business entity will have these financial statements.
You might also already have these documents from last year’s tax audit.
If you’ve never studied a financial statement before, I suggest that you read this section and apply what you learn here by studying your farm finances.
Note: These are only simplified examples, mainly presented to enhance your understanding. Read this resourceto get a more detailed step-by-step understanding of real financial documents for a farm. Or study this resource to get an idea of all the possible income and expense heads for your dairy farm.
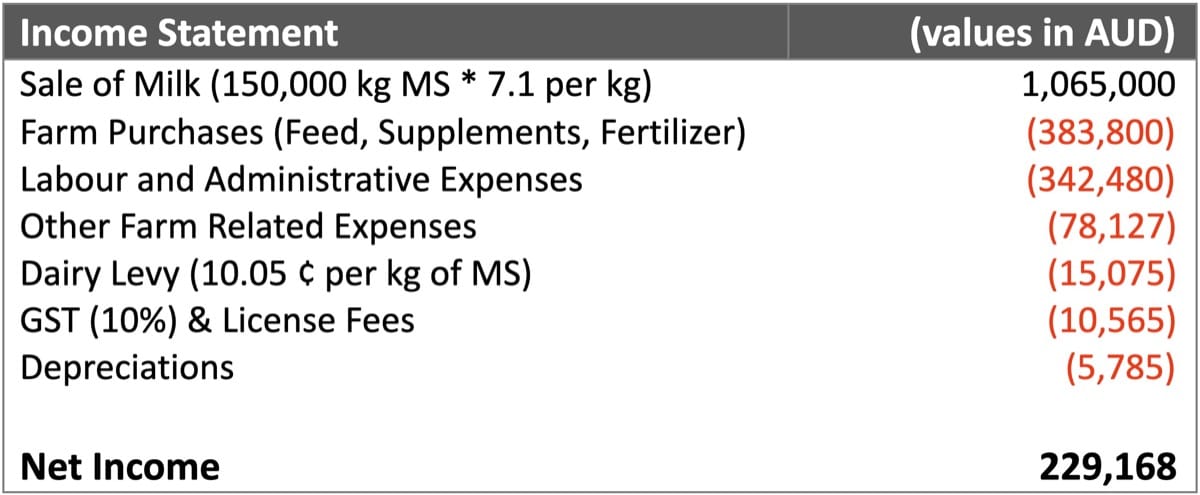
Income statement (How much did you make):
The first question to ask any financial statement is: Did the business make any money?
If so, how much profit did it make? The income statement is the most straightforward answer to this question.
It also shows you how much money came in and how much went out in any given year.
Here’s a sample income statement for a fictional dairy farm in Australia.
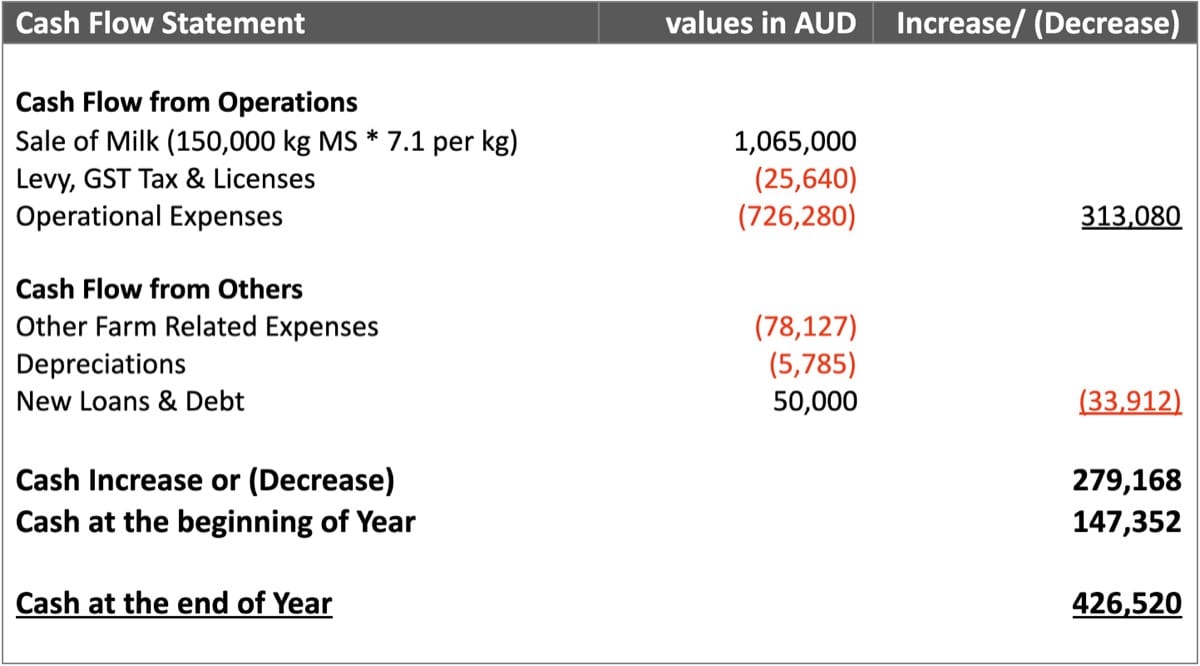
Cash Flow Statement (How well can you remain in business):
The next question to ask is: how much money came from what source and how much of it left the business?
The cash flow statement gives you this information and also shows you how much your flow of money has increased or decreased and more importantly how much of it you still have.
Balance Sheet (Your financial health report):
Finally, the most important document, the balance sheet shows you the entire picture of the business.
It can tell you everything about the assets, liabilities, and ownership interests of the business.
A balance sheet is prepared at the close of the business year, on the last day of the income statement period.
And the amounts reported in the balance sheet are the balances of the accounts at that precise moment in time.
Think of it as a scan report that can reveal the financial health of a business. This is also why, unlike the other two statements, the balance sheet doesn't show how the movement of assets or liabilities.
Instead, it only shows the ending balances at a particular moment in time.
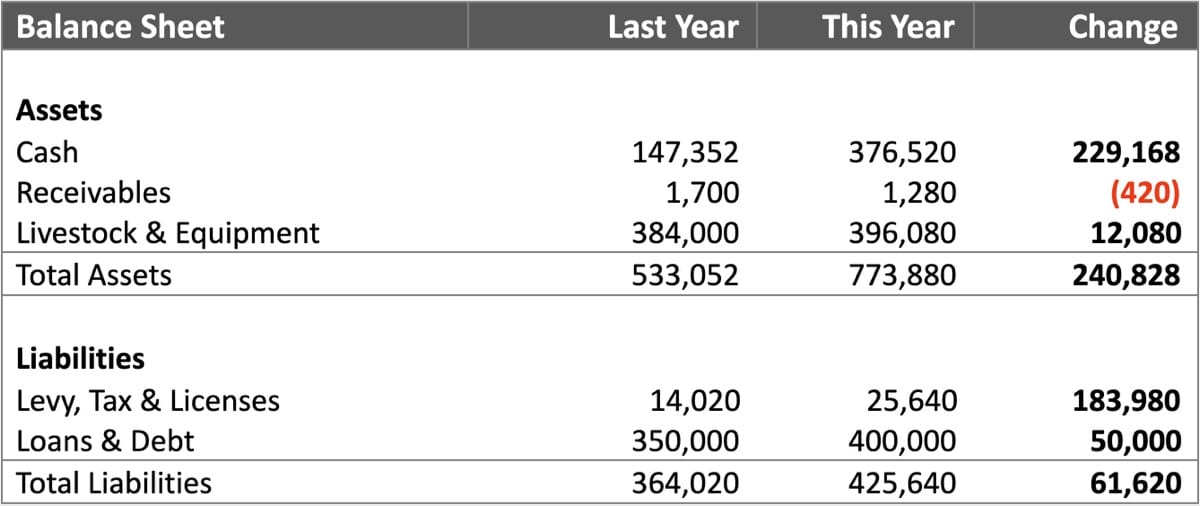
As shown above, a balance sheet typically has two distinctly separate sections – assets and liabilities. These two sections are also often compared with the previous year’s results to highlight key changes.
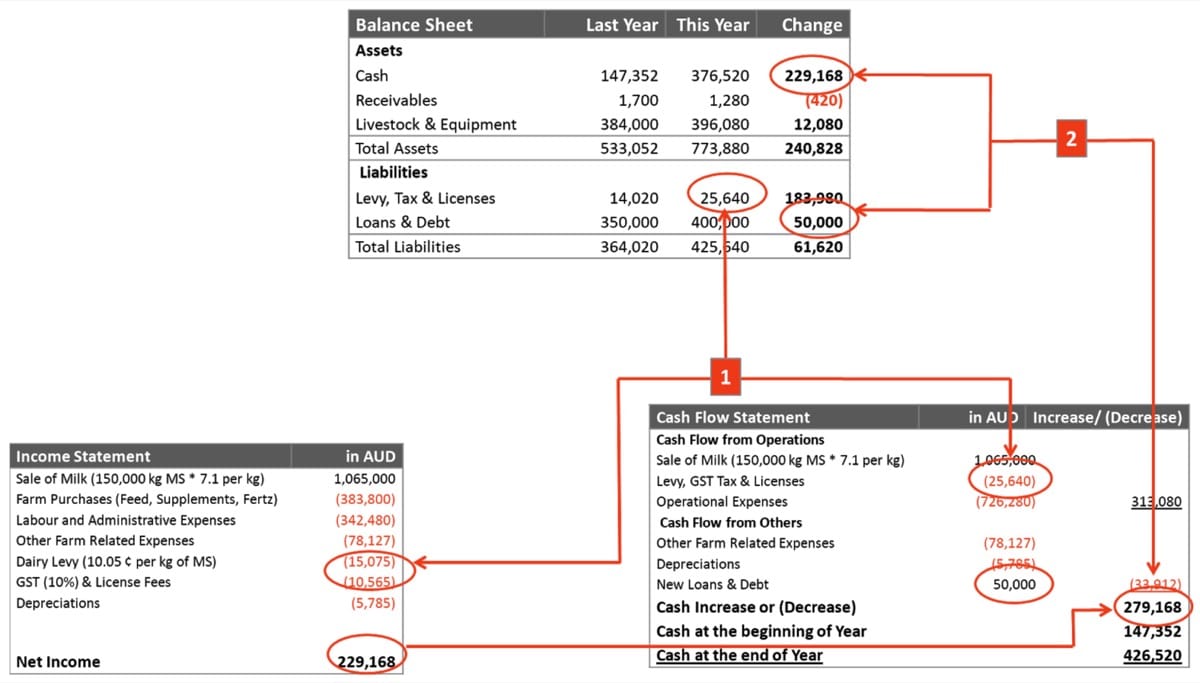
Making Sense of Your Financial Documents:
Because these financial documents are often presented as separate documents, it’s easy to miss seeing how they are interrelated to each other.
For example, let’s take two examples of how the three financial documents are related to each other.
In the first example, you can clearly see that dairy levy, GST tax and license fees in the income sheet, are all lumped together under one line-item in the balance sheet and cash flow statement.
Similarly, in the second example, the net income of 229,168 dollars derived in the income statement is transferred into the assets column of the balance sheet.
This is then added to the 50,000 dollar loan to represent the total money that entered the farm business that year.
The point here is that one needs to understand how each of these three financial statements talk with each other and what they each can help you understand about the business under scrutiny.
In case these numbers are too much for you to handle, it might help to further simplify things down.
- It might help to visualize a large dam of water for your farm (balance sheet).
- At any point in time, you can quickly assess how much water is left as surplus (assets).
- Conversely, how much water has left or will leave the tank to keep your farm operational (liabilities).
- Your income statement can show you the flow of water in and out of the tank.
- Think of your inlet pipe as income and outlet pipes as expenses.
- Finally, your cash flow statement can give you a more detailed analysis of how your water use has changed over time and whether you might run out of water on any given day.
This analogy might help you understand what these financial statements mean. And more importantly, help you to use these documents effectively, while drawing up next year plans and (water) budgets.
6. Planning & Budgeting
Planning and budgeting are both future forecasts.
In other words, they are informed guesses about what might happen.
As you know, it's near impossible to predict what might happen in the future. However, that doesn't mean that this is a futile exercise.
It can be very valuable; because it forces you to think about different scenarios and in turn that helps you identify the few critical things you need to focus most of your attention on.

Here are a few things to consider while planning and budgeting for the next year. Broadly we can split planning and budgeting as two separate areas that complement each other. Let’s look at both of these.
Stocking and Grazing Related Planning:
Under this section, you'll undertake tasks to:
#1 Estimate available forage:
The goal here is to know how much grass you'll have over the next year. This, in turn, can inform your stocking and supplemental plans.
This planning is best done with at least a year’s pasture growth records before you.
It is also better to estimate your forage in terms of dry matter kilograms (DM) per hectare and not just weight alone.
Because dry matter estimates don’t include the weight of moisture locked in your pasture and therefore can help you better estimate nutritional availability.
Take several growth measurements across your entire property using an RPM, C-Dax meter, drone or an automatic pasture growth measuring service such as Pasture.io. Informed by these measurements and previous year data – get an average estimate of how much forage you can grow in terms of kg DM/ ha.
For optimal regrowth, set your post grazing residuals to around 1,500 (to 1,700) kg DM/ ha. Finally, subtract this residual value from total available forage.
For example: if you measured an average total forage of 3,000 kg DM/ ha and set a post grazing residual of 1,500 kg DM/ha – your available forage will be 1,500 kg DM/ ha (3,000 minus 1,500).
Next, you multiply this available forage value into the number of grazable hectares to get your total available forage across one entire rotation.
For example, 1,500 kg DM/ ha multiplied by 236 hectares gives you a total of 354,000 kgDM/.
( pre-grazing cover - post-grazing residual ) * grazing platform =
( 3000 - 1500 ) * 236 =
available pasture = 354,000KgDM or 354tDM
This is how much herbage you can expect to get from one full grazing rotation, across all your paddocks.
Go on, give it a go yourself!
Pasture Available Calculator
-
Pre-grazing cover *
The amount of pasture at the point of grazing.
KgDM/ha -
Post-grazing residual *
the amount of pasture left after grazing.
KgDM/ha -
Grazing area *
Total amount of area on the grazing platform.
hectares -
Pasture Available in kilograms
Amount of Pasture Available for grazing over the entire platform.
0 KgDM
-
Pasture Available in tonnes
Amount of Pasture Available for grazing over the entire platform.
0 tDM
#2 Determine livestock DM intake:
Next, you need to calculate the amount of kg DM intake that your animals will consume every day. As a rough rule of thumb, this daily intake will be between 3% – 5% the bodyweight for animals such as beef cattle, dairy cows and sheep.
So at a daily intake of about 4% body weight, a 500 kg dairy cow is estimated to consume around 20 kg DM of feed on a daily basis. If you have 250 dairy cows, you would multiply this estimated daily feed intake with the total number of cows.
For example, 250 dairy cows * 20 kg DM/ day gives you a total feed requirement 5,000 kg DM every day. As you can see, this is only a simplified example; in reality, you will also have to account for lactating and dry cows along with calves.
#3 Determine rotation length:
Find out how long it takes for a grazed grass plant to grow 3 to 4 new mature leaves. This will usually differ from region to region, based on weather, rainfall and soil type.
If you are based in a cool weather region with adequate rainfall, your pastures will be able to fully recover in about 60 to 75 days. But this number may vary. The growth of three to four new leaves indicates that your plants have fully recovered and that it is ready for another round of grazing.
A good rotation grazing plan will allow each paddock long enough recovery periods before it’s next round of grazing. This will ensure optimal regrowth rates and higher overall yields. There will also be lesser wastage due to trampling and more available nutrition for the animals. Together, higher yields, less wastage and more nutrition can increase your overall production.
#4 Moving your herd:
Based on your paddock sizes, daily animal intake and rotation length, you will determine how often you need to move your herd, across paddocks. The more frequently you can move your animals, the closer you can achieve grazing targets.
However, beyond a point, you enter the territory of diminishing returns. So moving your herd every couple of hours is probably not a great investment of your time and effort. Instead, you’ll want to figure out a way to move your herd once or twice a day without compromising on achieving post-grazing residual targets.
#5 Calculating your farm’s carrying capacity:
The simplest way to calculate carrying capacity is to divide the total amount of forage DM available in one full rotation by the number of days you have chosen. This will give you the amount of forage DM that you can allocate to your animals per day. Divide that number by the daily DM intake of one animal. The result will be the number of animals that your land can sustainably carry.
For example, the total available forage in one full rotation (354,000 kg DM) divided by a 75 day rotation period gives you the daily forage available to your animals. In this case, this is about 4,720 kg DM/ day.
You can then use this available daily forage to determine the number of animals that can be sustained on pasture alone or calculate the amount of supplemental feed you need to provide a particular herd size.
For example, at 4,720 kg DM/ day, our fictional farm can sustain about 236 dairy cows on pasture alone (given that each cow needs about 20kg DM/ day). In case the farm plans to expand to 400 dairy cows, then it will need an additional supplemental feed of 3,280 kg DM every day.
Once you put all these planning estimates together, you begin to get an idea of what your rotation plan might look like. However, this is only a simple representation of a stocking and grazing plan. In reality, you would also factor in weather, calving and fertilizer changes to get accurate rotational grazing plans. But it is worth it because you can earn up to 80,000 dollars in additional profits.
This is why we built Pasture.io – to help you get several pasture growth updates a week, based on your farm records, local weather conditions and grazing patterns. To take the guesswork and legwork out of making effective daily grazing decisions.
Farm Budgeting:
Based on your grazing and stocking plans, and your previous year financial documents, you can then budget your farm activities with reasonable confidence. Under this you’ll typically look at:
- Estimating yearly farm operational expenses (seeds, fertilizers, labour etc.)
- Estimating any new one-time purchases or investments (new effluent pond etc.)
- Estimating production and sales incomes
- Estimating profit or loss
- Identify sources of capital (bank loans etc.)
The farm budgeting can be as detailed or as high-level as you need it to be. However, I’ll end by saying that a good farm budget should be able to help you adjust and allocate available capital for each key farm activity. It might also help you plan better for contingencies against unexpected droughts, diseases or market uncertainties. Talk to your farming friends and farm advisor for more advice on this.
With that, we come to the end of this guide. So far, we learnt about:
- Defining successful farm outcomes
- Managing production
- How information systems can help you take effective decisions
- Understanding differences and diminishing returns
- Understanding farm finances
- Planning and budgeting for the year ahead
We trust that this was useful to you. And more importantly that this might help you make more effective farm management decisions. If so, please consider sharing this with other farmers you know.