The World Dairy Industry
Practical pasture decisions for farms that need clear, reliable information.
What Dairy farming across the world is today? And what it might be tomorrow.


Increasing urbanisation and rising income levels over the last few decades have changed our diet preferences. Today, dairy products have become an indispensable part of modern life across the world.
And yet there isn’t one single type of dairy farm that produces most of our milk. On the contrary dairy farms across the world vary to a large extent in terms of size, type of farming practised and productivity.
Let’s begin by studying global milk production in more detail.
This free guide will give you all the information you need at your fingertips in one place. It is divided into 6 sections:
Global Milk Production Statistics
As shown below, we produce approximately 850 million tonnes of milk across the world every year. India, the European Union and the USA continue to be the top milk-producing regions.
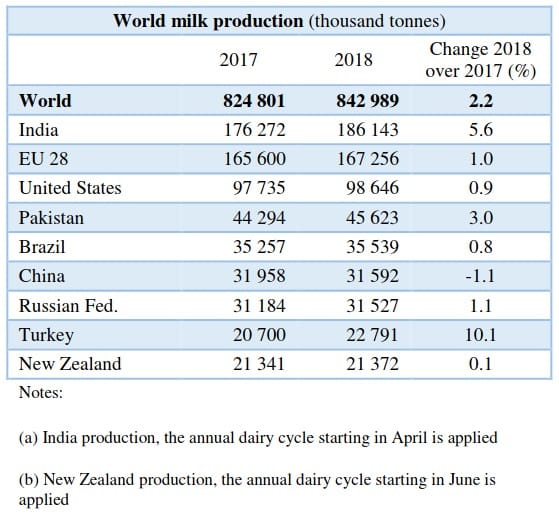
Among top milk-producing countries, milk production grew by 10.1%, 5.6% and 3% in Turkey, India and Pakistan respectively.
Let’s look at how milk production has increased across several regions in more detail.
How Milk Production Has Increased
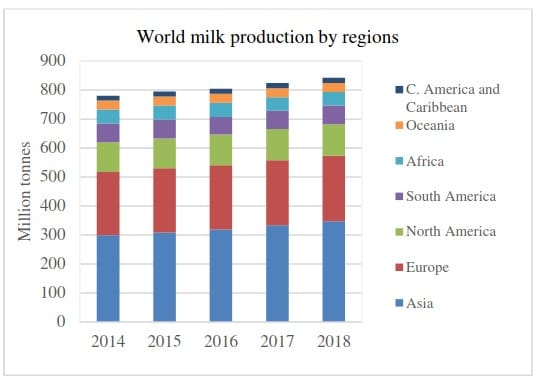
Today it is estimated that we have more than 100 million dairy farms across the world. Collectively they produced close to 850 million tonnes of milk in 2018.
Asia, Europe and North America were the top 3 milk-producing regions of the world, accounting for more than 80% of all milk production.
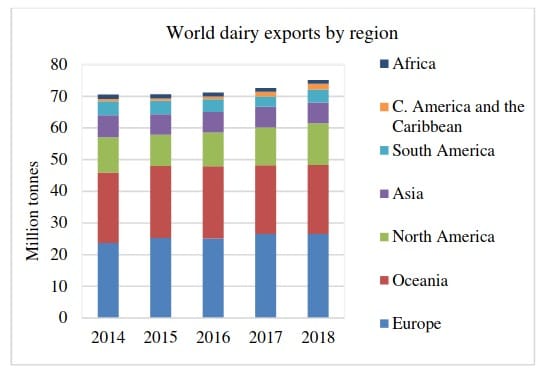
Of the total milk produced, about 75 million tonnes of milk and related dairy products such as butter and milk powder was exported to other countries. Europe, Australia and New Zealand lead the dairy export market, contributing to almost 50% of the total dairy exports.
Compared to 2017, milk production in 2018 increased by 2.2% due to higher outputs across all regions.
In Asia, milk outputs increased by around 347 million tonnes, a 3.9% increase in production from 2017. Higher outputs across India and Pakistan mainly drove this growth.
In Europe, milk outputs increased by around 226 million tonnes, a 0.8% increase in production from 2017. Higher outputs across the European Union, Russia and Belarus drove this growth.
In North America, milk outputs increased by around 108 million tonnes, a 1.1% increase in production from 2017. Higher outputs across USA and Canada drove this growth.
In South America, milk outputs increased by around 64 million tonnes, a 1.6% increase in production from 2017. Higher outputs across Argentina, Brazil and Chile drove this growth.
In Central America, milk outputs increased by 1.1% from 2017, mainly contributed by growth in Mexico’s milk production.
In Africa, milk outputs increased by 1.1% from 2017, mainly contributed by growth in Kenya, South Africa and Morocco’s milk production.
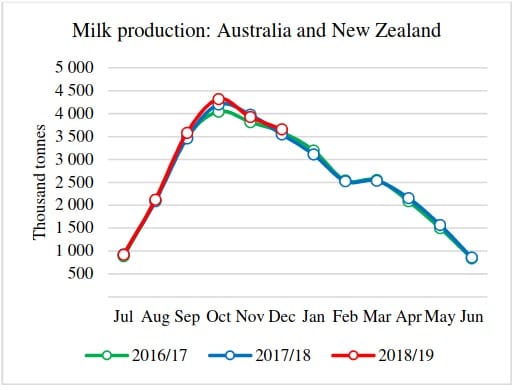
In Oceania, milk outputs increased by 1% from 2017. New Zealand’s milk production grew by 4.4% while Australia’s milk production fell by 3.8% due to persistent warm weather and drought.
As a dairy farmer you that milk production is only one side of the story. One of the most important factors that affect productivity in dairy farms is feed.
Let’s look closer at how feed varies across countries, climates and farm types.
Feeding Systems & Feed Efficiencies
In a report by FAO, IDF and IFCN they studied several farms across 44 major milk-producing nations and published data to answer questions such as:
- What kind of feeding systems each country uses?
- What is the average total feed intake (Kg DM per cow per year)?
- What is the annual feed efficiency (Kg milk produced per Kg of DM consumed)?
- And what is the average number of cows in each country?
This data was either not available or was not published for all significant milk-producing countries. Yet, it is still useful to understand the variety of dairy farming systems practised around the world.
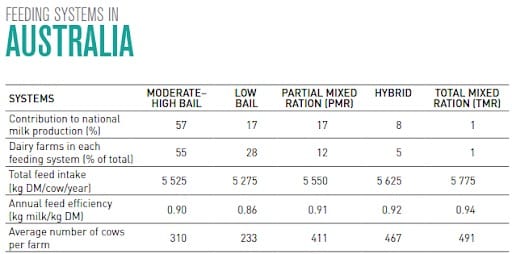
In Australia:
Dairy farmers in Australia mainly practice at least five different feeding systems, based on how much silage they feed cows. The average Australian dairy farm has more than 300 cows, and each cow has a total annual feed intake of about 5,525 Kg DM.
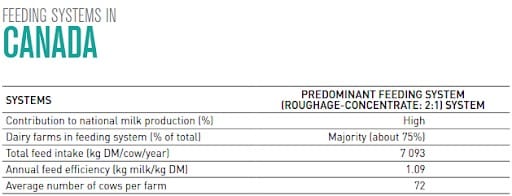
In Canada:
Dairy farmers in Canada mainly practice a roughage-concentrate feeding system. The average dairy farm in Canada has about 72 cows, and each cow has a total annual feed intake of about 7,093 Kg DM.
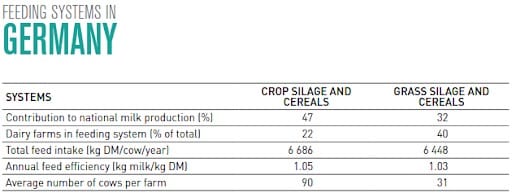
In Germany:
German dairy farmers mainly feed their cows cereals and silage. The average dairy farm in Germany has about 90 cows, and each cow has a total annual feed intake of about 6,680 Kg DM.
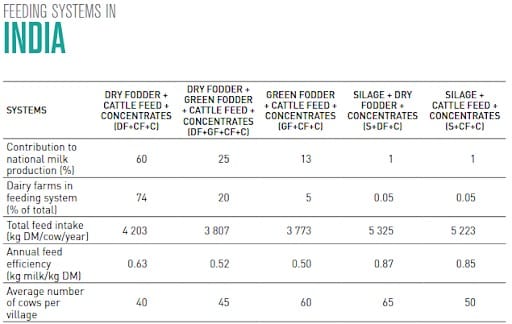
In India:
Dairy farmers in India practice at least five different feeding systems, mostly based on roughage and varying amounts of concentrate feed.
Large dairy farms in India can have between 40 and 65 cows, and each cow can have a total annual feed intake of between 3,773 and 5,223 Kg DM.
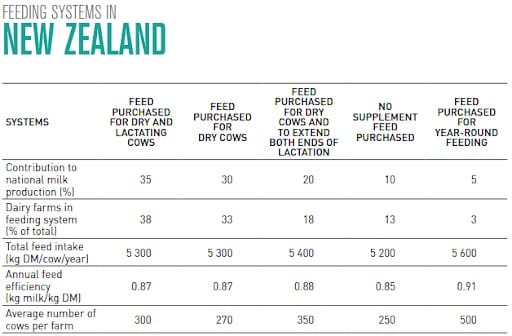
In New Zealand:
Dairy farmers in New Zealand mainly use their pastures as well as purchased feed in varying amounts.
However, only 3% of farms that have more than 500 cows purchase feed throughout the year. And 13% of the farms rely exclusively on their pastures.
All the other farms use purchase feed to supplement their pastures in varying amounts.
The average dairy farm in New Zealand has about 350 cows, and each cow has a total annual feed intake of about 5,300 Kg DM.
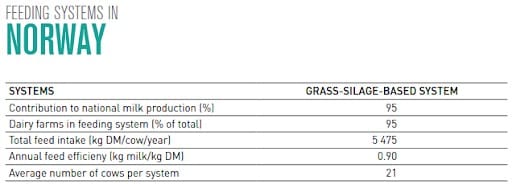
In Norway:
Dairy farmers in Norway mainly practice a grass silage based feeding system.
The average dairy farm in Norway has about 21 cows, and each cow has a total annual feed intake of about 5,475 Kg DM.
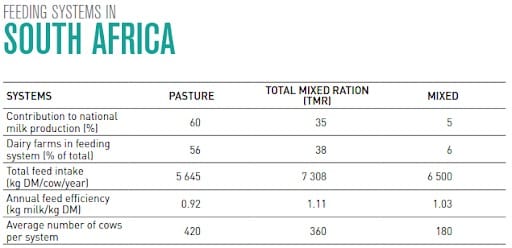
In South Africa:
The majority of South African dairy farmers practice a pasture feeding system.
About 40% of them also use concentrates and other purchased roughage to supplement their pastures.
The average dairy farm in South Africa has about 72 cows, and each cow has a total annual feed intake of about 7,093 Kg DM.
In The United Kingdom:
Dairy farmers in the United Kingdom mainly practice a mixed feeding system.
The average dairy farm in the UK has more than 186 cows, and each cow gets a total annual feed intake of about 6,500 Kg DM.
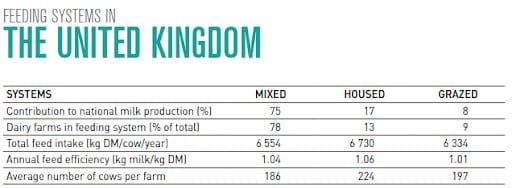
This data, among other things, reveals three insights.
Firstly, it shows that developed industrialised countries such as Canada, Germany and the United Kingdom have bigger dairy farms. On average, these countries had 72, 90 and 186 cows per farm.
These countries also rely more on purchased grains and concentrate. Therefore, they also had the highest feed efficiencies.
Secondly, it shows that countries such as New Zealand, Norway and South Africa mostly use their pastures to feed cows. While these countries may not have the highest feed efficiencies, they certainly have lower milk production costs.
In addition to lower costs, pasture-based systems also have the smallest environmental footprint among all other dairy feeding systems.
And thirdly, it shows that hot tropical countries such as India can produce a lot of milk, across many small dairy farms.
However, Indian dairy farms had the lowest feed efficiencies. For example, compared to the feed efficiencies of Canada (1.09) and UK (1.06), dairy systems in India can have feed efficiencies as low as 0.50. Much lower than the feed efficiencies of pasture-based systems in New Zealand (0.88) and Norway (0.90).
This data is instrumental in helping us understand the various nuanced dairy farming and feeding systems across the world.
However, there is no data about this for major milk-producing countries such as China, the United States of America and Pakistan. And therefore, doesn't give us a complete view of global dairy feeding systems.
Farm Sizes & Stocking Rates
Besides feed, the size of farms and their stocking rates are also equally important to understand the dairy industry.
New Zealand, Australia, South Africa and the UK had the largest dairy cow herd sizes. For instance, New Zealand and Australia, the two leading countries in terms of herd size, respectively had an average of more than 350 and 200 cows per farm.
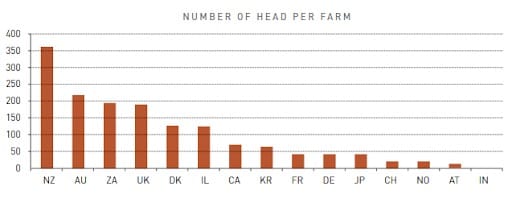
There was a lot of variation in terms of herd sizes, both across regions as well as within continents.
For instance, in Europe, farms in Italy had as much as 154 cows and as few as 14 cows in Austria. Similarly, in Africa, South Africa had as much as 185 cows and as few as three cows in Uganda.
In the Americas, this variation was the biggest, ranging between 2,218 cows in North America to 7 cows in Peru. Oceania had the largest average herd sizes at 351 in New Zealand and 225 in Australia.
On the other hand, Australia, Canada, the UK, South Africa and New Zealand had the maximum number of hectares on average per dairy farm.
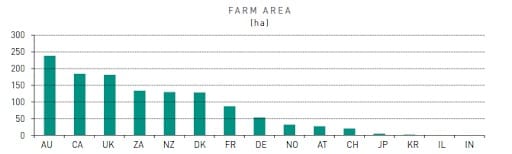
Compared to this, Asian countries like India, Korea, Japan and China have much smaller farms. Many of them are in these countries are dairy farms on less than a hectare.
This pattern of small landholdings explains why these countries have small herd sizes, but more livestock units per hectare.
With lesser area to grow or produce roughage, small landholdings also explain why these countries typically have higher feed costs, as dairy farmers need to buy most of their animal feed.
Milk yields, What Dairy Cows Eat & How It Affects Productivity
Everything that dairy farmers do is to produce milk. So let’s look at milk yields across the world.
Average milk yields
Average milk yields represent the mean volume of milk produced per animal per year for the entire herd.
In the 2014 study by FAO, IDF and IFCN, average milk yield was expressed as kilograms of energy-corrected milk (ECM; standardised to the fat content of 40 g/l and protein content of 32 g/l) per cow per year.
Based on data from the study, milk yields ranged between 650 kg per cow per year in Cameroon to more than 11,000 kg per cow per year on a farm in New York.
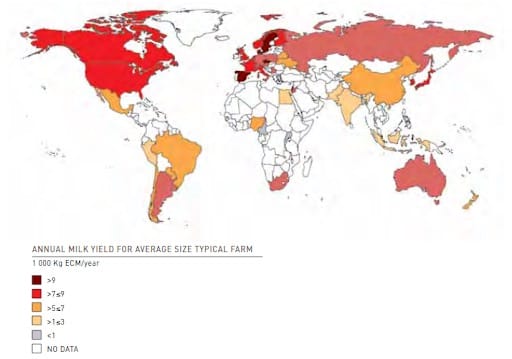
As you can see from the map, the average milk yield is highest in North America and Western Europe. At the same time, it is the lowest in Asia and Africa.
Milk production is driven by several factors such as the genetic potential of the animal, environmental conditions and management practices. But most importantly, milk production depends a lot on the type of feed, its nutritive value, and how digestible it is.
So to get a better understanding of dairy farmer priorities and resource constraints, let’s study what dairy cows are fed, across the world, in more detail.
All feed such as green fodder, pasture, hay, silage and fodder crops are categorised as roughage feed. While all supplements, grain, oilseeds, cakes, meals and related by-products are categorised as concentrates.
In other words, everything that a cow eats can be categorised into roughage and concentrates. And its total will always add up to 100% of feed ration, across feeding systems and countries.
Roughage as part of the feed ration
In the study by FAO, IDF and IFCN, the percentage of roughage was expressed as the percentage of dry matter intake of roughage to the total feed consumed by an animal every year.
Any hay, silage or crop residues are classified as roughage.
In general, across the world, a majority of roughage is produced on the same farm. However, in some large feeding systems, a substantial portion of the roughage may be purchased from other sources.
As discussed earlier, roughage makes up a significant portion of dairy feed rations.
As you can see in the below map, New Zealand and a few countries across South America have the highest roughage feed ratios across the world mainly because these countries enjoy a cool temperate climate through most parts of the year and practice pasture grazing systems.
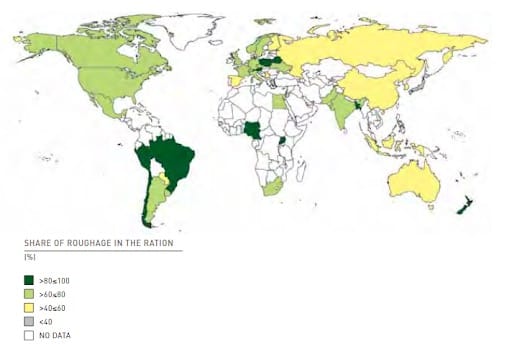
Because roughage represents a significant part of the total feed ratio, it has a substantial impact on feed efficiency.
Concentrates as part of the feed ration
In the 2014 study by FAO, IDF and IFCN, concentrates are defined as supplements that dairy producers feed cows, in addition to roughage. By definition, concentrates and roughage represent the totality of feed consumed by the animals (100 percent).
Concentrates are an essential part of the cow’s diet. It provides the required energy and protein. This is why concentrates are typically processed raw grains or oilseeds or their processed by-products.
The percentage of concentrates is expressed as the percentage of dry matter intake of concentrates to the total feed consumed by an animal every year.
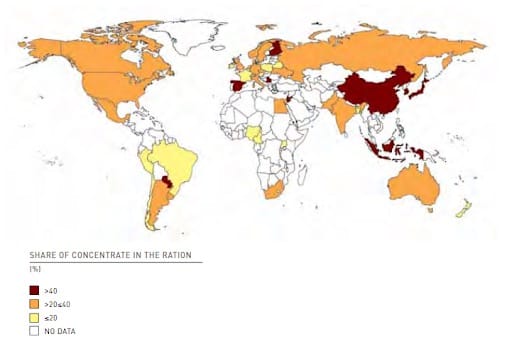
Concentrates in some cases are grown on the farm but may also be purchased off markets. In addition to raw grains and oilseeds, concentrates may also include processed or blended by-products such as distiller’s grains, citrus pulp or cottonseed.
Just to separate these by-products from raw grains and oilseeds, the study also has classifies processed feed as a subcomponent of concentrates.
It is defined as concentrates that are made from various raw materials, either in granulated, non-granulated or mashed forms. Typically processed feeds undergo some kind of mechanical mixing and industrialised transformation.
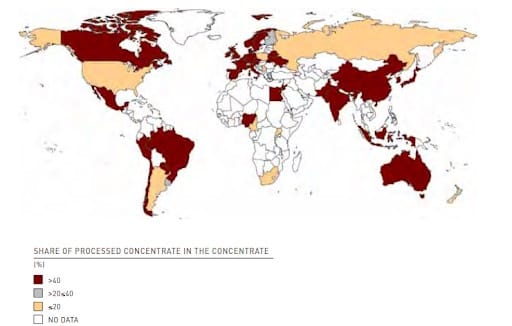
As you can see from the above map, several notable countries such as Australia, Brazil, Canada, China, Mexico, India and the United Kingdom use between 40% to 60% of processed feed as a part of their concentrate ration.
The Economics of Dairy Feeding Systems
Feed cost usually has the most significant share in the cost of milk production; therefore analysing feed costs in more depth can improve farm profitability.
Feed cost is defined as the US dollars (US$) needed to produce100 kg ECM milk. The feed costs were calculated using the Activity Based Costing method, which also accounted for variable costs such as purchased feed, labour, land used for feed production and other related on-farm inputs.
This cost was then divided by the total cost of milk production to get the percentage share of feed cost. Based on the results from the average farms analysed, we clustered the feed cost into three categories: high, average and low share of feed cost in the total cost.
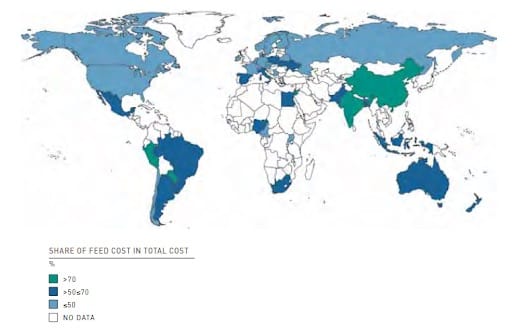
As you can see from the above map, in countries across East Asia and Latin America feed costs accounted for more than 70% of the total milk production costs.
This might be explained on two fronts. One, that they purchase most of their roughage and concentrates. And two, that other milk production costs such as labour and machinery are either negligible or play a much smaller role.
Also, the above map shows that countries across Central and South America, Africa, Oceania and southern parts of Europe all have feed costs that account for more than half their total milk production costs. Again, this may be due to either lower purchased feed costs or higher labour and machinery costs.
When More Milk Becomes Costly
From the dairy farm data collected across 44 countries, it is clear that higher feed efficiencies lead to increased milk yields. But at what cost?
To answer that, let’s compare two dairy farming systems in terms of feed efficiency and cost of milk production.
It costed a European dairy farm with a feed efficiency of 1.22 kg ECM per kilogram of DM more than 50 USD per 100 Kg ECM to produce 22.5 kg ECM milk per day. On the other hand, it costed a Southeast Asian farm with a feed efficiency of only 0.38 kg ECM per kilogram of DM intake only 25 USD per 100 Kg ECM to produce 2.4 kg ECM milk per day, but with much lower milk production costs (25 US$/100 kg ECM).
In other words, the cost of producing more milk beyond a point, by optimising feed efficiencies, can significantly increase milk production costs. And at times, even double milk production costs when compared to lower feed efficiency systems.
The only anomaly to this can be found in countries like Norway, New Zealand and South Africa, where a cool-temperate climate prevails, making it conducive to grow highly productive pastures, through the year. This also explains why dairy farmers in New Zealand and South Africa can manage large herds of more than 350 cows and still have comparatively lower milk production costs.
But how are these dairy farming practices going to change over the next few decades? And what role will technology play?
Technology & Future Trends
Two major changes are set to happen over the next decade.
First, the global demand for milk and animal products are set to increase by over 70% in the next three decades. This means that we will need to farm more animals per hectare, with our existing resources.
And second, we are at the cusp of several technology breakthroughs. As we speak, major technology advances are becoming more accessible and affordable to progressive farmers.
Let's study both these changes in more detail.
Fewer Farms, More Animals and Higher Productivity
Until recently, animal farming has mostly been decentralised, on a scale that a few individuals can get together and manage. This is why most animal farming operations, more or less, had the same productivity.
But now, several modern technologies such as high-speed internet, smartphones, cheap computing power, artificial intelligence and satellites are helping progressive farmers grow more animals per hectare and have better productivity gains. And only a handful of farmers are leveraging these productivity gains.
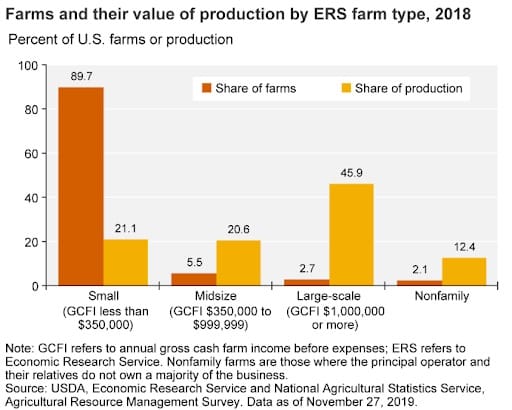
For instance, in Australia, agricultural productivity and performance were driven by only a handful of large farms. Only about 16% of all farms in Australia are categorised as large and productive farms that have annual sale receipts over one million dollars.
What’s more important is that 16 % of large and productive farms now account for more than 60% of the total produce and farm income in the country. In other words, a few farms are reaping in the lion’s share of productivity returns and profits.

This trend is not unique to Australia. For example, we also see a similar pattern in the United States of America. Here, less than 5% of their farms now produce more than half their food.
The trend is clear, at least across wealthy, industrialised and developed nations. A few large farms are now producing most produce and are in turn earning the lion's share of total farm income.
To sum things up – To earn more income, you need to become as productive as those few handfuls of farms. But how do you do that?
Technology & Increasing Productivity
This brings us to the next significant change, a tipping point in adopting technology to improve farm productivity.
Today, more than half the global population is connected to the internet either through smartphones or computers. Cheap phones that fit in our pockets now have greater computation power than the computers on Apollo 11, the first manned spacecraft to land on the moon.
In other words, significant computing power is now easily accessible to millions of animal farmers like you.
To meet the growing demand for animal products, animal farming operations need to become more centralised, large scale and efficient. And technology can help you do this.
In other words, technology has the potential to act as force multipliers to amplify your outputs several times. Already, the most productive and profitable farms are adopting technology and leveraging these force multipliers while the not so successful farms aren't doing so.
Technology is set to change the face of animal farming as we know it.
Why? Because advanced technologies such as sensors, big data, artificial intelligence (AI) and machine learning (ML) can help farmers like you lower production costs, increase efficiencies and grow significantly more animals per hectare.
How? Let me answer this by giving you a few examples.
Managing Disorders & Diseases
Technology can now help you identify, predict and prevent several diseases that may affect your animals. The best part is that it can help you do this much before symptoms become evident. In other words, it can help you take timely interventions and prevent significant financial as well as animal life losses.
For example, it can track movement patterns of your cows, identify abnormalities and predict disorders such as mastitis, lameness and postpartum. As these disorders reduce both the quality and quantity of milk, such technology-based early detection methods can help you avoid low productivity and profits. Similarly, technology has been used to predict contagious diseases such as swine flu and coccidiosis successfully.
Facial Recognition Applications
Identifying a particular animal among a herd of cows or pigs is one of the first steps in improving animal health outcomes. But this has always been a problem, especially for large scale animal farmers. Now, facial recognition systems that make use of various cameras, big data and advanced algorithms can accurately identify an individual among a herd of animals.
For example, a cow-face detection system when coupled with the PANSNet-5 recognition model, can now detect individual cow faces with 98.3% accuracy. In another example, technology was used to understand the emotions of a cow. This can potentially enhance the welfare of animals in a large herd. And finally, technology can also be applied to gauge the amount of pain that animals encounter.
Optimising Feed Efficiencies
Feed costs can add up to 40% to 60% of the total expense on a dairy farm. It is one of the most significant expenditures of animal farming. Successful farmers always have their feed numbers at the tip of their fingers. Now, technology can help them to further optimise their feed efficiencies by taking into account factors such as the amount of feed intake, type of feed, cost of feed, weight gained by animals, and productivity.
Precision Farming Systems
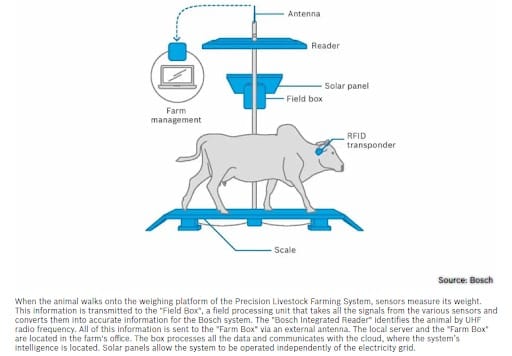
Leading companies like Bosch are now investing heavily into R&D of artificial intelligence-based precision livestock farming systems that can automatically give farmers quality information about their herd. It can tell you how many animals are on the pasture and how many of them are healthy.
On the other hand, several companies have now developed low-cost GPS-based collars to help farmers like you manage their animals. In addition to this, there is now equipment available to detect when cows are in heat, calving, or have contracted infectious diseases and metabolic disorders. According to the latest research Caja et al., 2016, these advancements have significant potential to improve animal welfare.
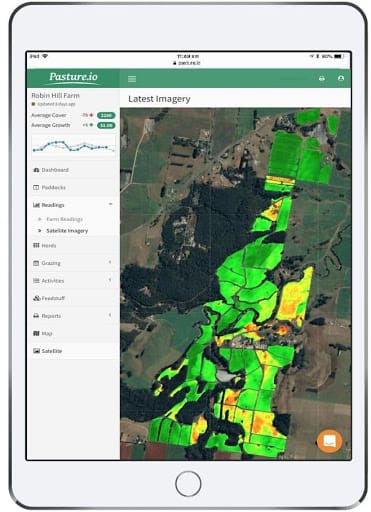
Measuring Your Pasture Automatically
As discussed earlier, measuring and managing your pasture is the single most significant opportunity for progressive animal farmers like you to increase farm productivity and earn better profits.
Measuring pasture can help you make more than 350 dollars in additional profits per hectare every year.
Yet, many farmers don’t fully take advantage of their pastures, because measuring and managing it takes up a lot of their time.
Satellite-based technology services such as Pasture.io, helps dairy and beef farmers to measure and manage their pastures, automatically.
You get automatic pasture utilisation recommendations on your phone, several times a week.
Farmers who use this service now make up to 80,000 dollars, every year in additional profits.
These examples show how technology can act as force multipliers and help you amplify your outcomes.
It can help you become one of the few productive farms in your country.
The question now is, will you use your understanding of dairy farming trends and leverage technology to become one of the productive farms in your country?