
Managing Spring Pasture Growth
Practical pasture decisions for farms that need clear, reliable information.
Why optimise your spring pasture growth?
Many grazing systems are setup to maximise their pasture production through the spring flush for such practices as feeding peak herd size or for conserving fodder to supplement the herd through the following summer or winter.
Spring pasture growth is typically high due to adequate soil moisture levels, increasing soil temperatures and lengthening sunlight hours. However, without sound grazing practices a large lost opportunity of growth may occur. The old adage you can’t grow quantity without quality and you can’t grow quality without quantity starts to ring through as we dive deeper into this discussion.
Finding the balance between how hard you graze your herd, or put another way, how hard you graze your pasture throughout winter will determine how your pasture will perform throughout the spring. Through winter, when you let pasture covers grow past 3 leaves or leave post grazing residuals below 1500 KgDM/ha, you are ultimately sacrificing both the potential quantity and quality of pasture grown in Spring.
The question is raised, how can we best setup the farm for maximising the spring pasture growth, while maintaining pasture quality?
We have found that our Pasture.io farmers that protect their post grazing residuals (>1500-1700KgDM/ha) through winter achieve more pasture production through spring. Not only that, but due to protecting their pasture sward, they actually bring forward their spring growth by two to three weeks. Ultimately your farm’s average pasture cover should be maintained at or near the same level all year round ignoring the months where paddocks due for fodder harvesting skew the chart positively.
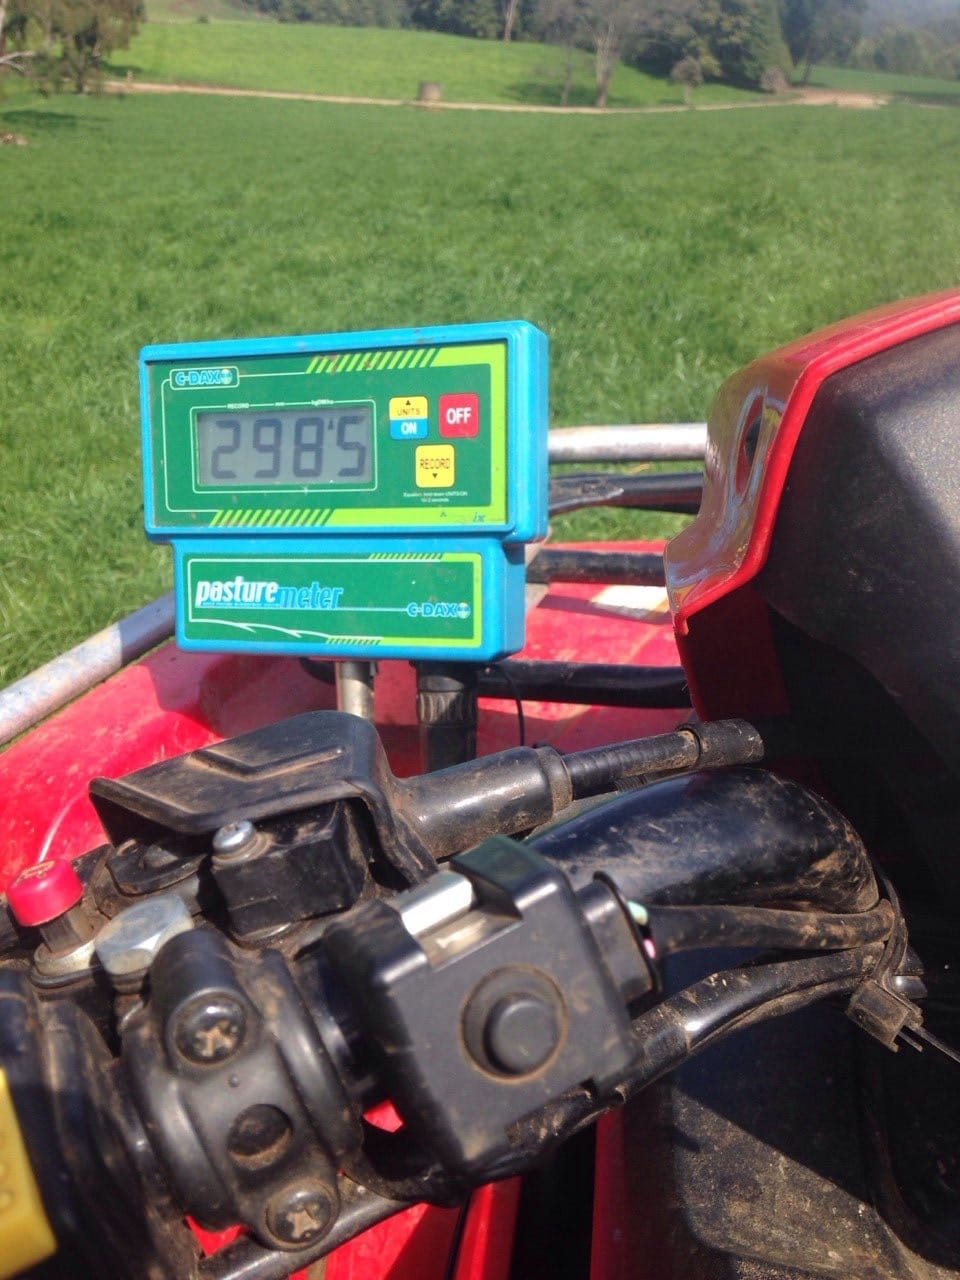
Measuring Pre-Grazing Pasture Cover with a CDax
Case Study with Robin Hill
Below is the Monthly Farm Cover chart taken from the dairy farm Robin Hill. The pink line represents the average pasture cover per month going back to 2006, the blue and green lines represent the most recent two years of data. This displays how their grazing practices have changed over time. They would historically target a significantly lower pasture cover especially through the critical winter months of June, July and August, which severely limited their growth into spring as seen by the lower heights of pasture covers.
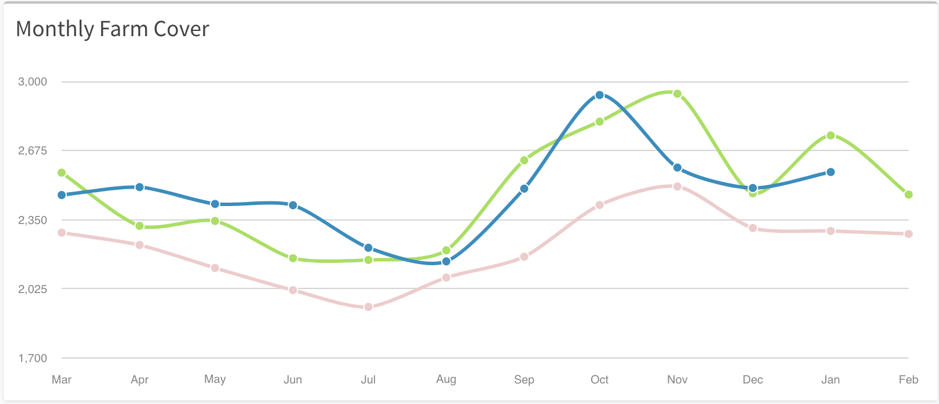
Monthly Farm Pasture Cover Graph
Above is the Monthly Farm Growth Rate chart taken from the dairy farm Robin Hill. The pink line represents the average pasture growth rate per month going back to 2006, the blue and green lines represent the most recent two years of data.
Further to the Monthly Farm Cover chart, the growth rate response through the early spring flush months of September and October have significantly shifted to the left, or two weeks earlier than the historical average growth rate.
It is important to note that the pink line above is the average, which includes both the blue and green lines as well as the historical data. Perhaps when I have time, I’ll extract the median data points, as well as separate the most recent two to three years, which will highlight that spring growth rate response is now two to three weeks earlier at Robin Hill than it was in 2008. Furthermore, and to those interested in the growth rate dips and peaks through spring and summer at Robin Hill, this is directly related to silage paddocks coming in and out of the round as they are harvested.
You can do the maths on what an earlier growth rate response would mean to you in terms of increasing farm productivity. But if you’d like help in this area, please feel free to get in touch with us.
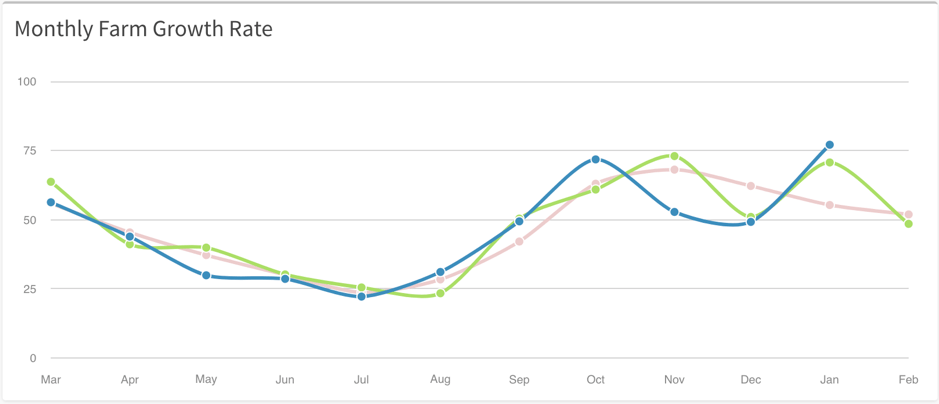
Monthly Farm Pasture Growth Rate Graph
What are your experiences?
We'd love to hear your feedback, or if you have some great tips that we can share in the post above - please feel free to get in touch or leave a comment below.